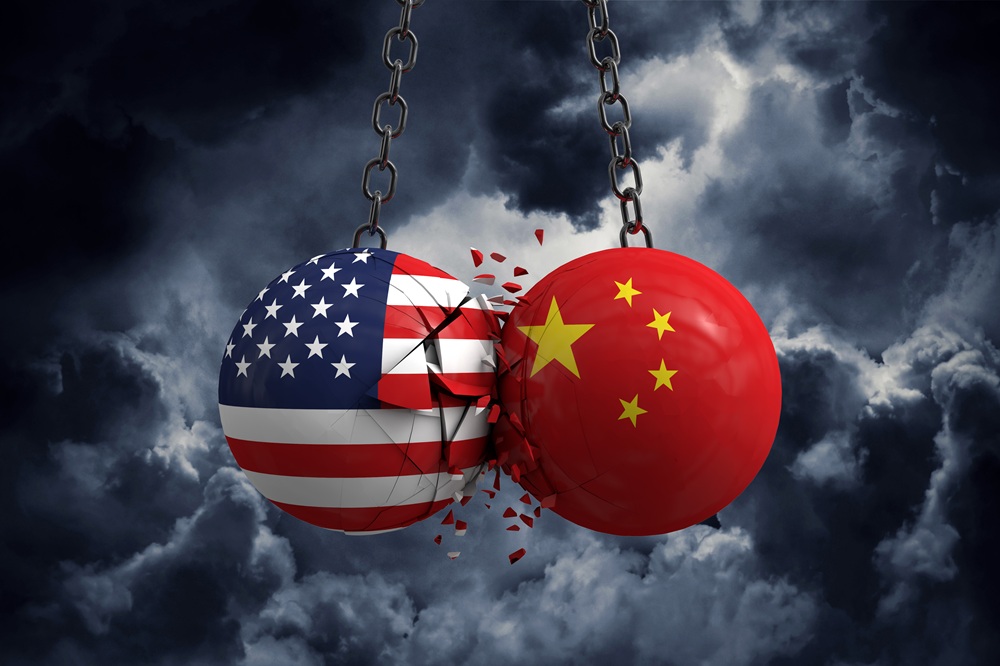
We would suggest that right now Markets are underestimating the impact of April 2 US Reciprocal Tariffs – aka Liberation Day monikered by the President.There is consistent and constant chatter around what is being referred to as The Dirty 15. This is the 15 countries the president suggests has been taking advantage of the United States of America for too long. The original thinking was The Dirty 15 for those countries with the highest levels of tariffs or some form of taxation system against US goods. However, there is also growing evidence that actually The Dirty 15 are the 15 nations that have the largest trade relations with the US.That is an entirely different thought process because those 15 countries include players like Japan, South Korea, Germany, France, the UK, Canada, Mexico and of course, Australia. Therefore, the underestimation of the impact from reciprocal tariffs could be far-reaching and much more destabilising than currently pricing.From a trading perspective, the most interesting moves in the interim appear to be commodities. Because the scale and execution of US’s reciprocal tariffs will be a critical driver of commodity prices over the coming quarter and into 2025.Based on repeated signals from President Trump and his administration, reinforced by recent remarks from US Commerce Secretary Howard Lutnick. Lutnick has indicated that headline tariffs of 15-30% could be announced on April 2, with “baseline” reciprocal tariffs likely to fall in the 15-20% range—effectively broad-based tariffs.The risk here is huge: economic downturn, possibilities of hyperinflation, the escalation of further trade tensions, goods and services bottlenecks and the loss of globalisation.This immediately brings gold to the fore because, clearly risk environment of this scale would likely mean that instead of flowing to the US dollar which would normally be the case the trade of last resort is to the inert metal.The other factor that we need to look at here is the actual end goal of the president? The answer is clearly lower oil prices—potentially through domestic oil subsidies or tax cuts—to offset inflationary pressures from tariffs and to force lower interest rates.‘Balancing the Budget’Secretary Lutnick has specified that the tariffs are expected to generate $700 billion in revenue, which therefore implies an incremental 15-20% increase in weighted-average tariffs. We can’t write off the possibility that the initial announcement may set tariffs at even higher levels to allow room for negotiation, take the recently announced 25% tariffs on the auto industry. From an Australian perspective, White House aide Peter Navarro has confirmed that each trading partner will be assigned a single tariff rate. Navarro is a noted China hawk and links Australia’s trade with China as a major reason Australia should be heavily penalised.Trump has consistently advocated for tariffs since the 1980s, and his administration has signalled that reciprocal tariffs are the baseline, citing foreign VAT and GST regimes as justification. This suggests that at least a significant portion of these tariffs may be non-negotiable. Again, this highlights why markets may have underestimated just how big an impact ‘liberation day’ could have.Now, the administration acknowledges that tariffs may cause “a little disturbance” (irony much?) and that a “period of transition” may be needed. The broader strategy appears to involve deficit reduction, followed by redistributing tariff revenue through tax cuts for households earning under $150K, as reported by the likes of Reuters on March 13.The White House has also emphasised a focus on Main Street over Wall Street, which we have highlighted previously – Trump has made next to no mention of markets in his second term. Compared to his first, where it was basically a benchmark for him.All this suggests that some downside risk in financial markets may be tolerated to advance broader economic objectives.Caveat! - a policy reversal remains possible in 2H’25, particularly if tariffs are implemented at scale and prove highly disruptive and the US consumer seizes up. Which is likely considering the players most impacted by tariffs are end users.The possible trades:With all things remaining equal, there is a bullish outlook for gold over the next three months, alongside a bearish outlook on oil over the next three to six months.Gold continues to punch to new highs, and its upward trajectory has yet to be truly tested. Having now surpassed $3,000/oz, as a reaction to the economic impact of tariffs. Further upside is expected to drive prices to $3,200/oz over the next three months on the fallout from the April 2 tariffs to come.What is also critical here is that gold investment demand remains well above the critical 70% of mine supply threshold for the ninth consecutive quarter. Historically, when investment demand exceeds this level, prices tend to rise as jewellery consumption declines and scrap supply increases.On the flip side, Brent crude prices are forecasted to decline to $60-65 per barrel 2H’25 (-15-20%). The broader price range for 2025 is expected to shift down to $60-75 per barrel, compared to the $70-90 per barrel range seen over the past three years.Now there is a caveat here: the weak oil fundamentals for 2025 are now widely known, and the physical surplus has yet to materialise – this is the risk to the bearish outlook and never write off OPEC looking to cut supply to counter the price falls.

Reportingdates and release times are based on company investor relations calendars whereconfirmed. Where dates or times are not marked confirmed, they are GO Marketsestimates. Consensus EPS, revenue and analyst-range data are sourced fromBloomberg and Earnings Whispers, as at 09 July 2026 (AEST). Company guidance,backlog and operating metrics are sourced from the latest company filings orresults presentations, unless stated otherwise. Any scenario analysis reflectsGO Markets analysis. Figures and schedules may change without notice.
The information provided is of general nature only and does not take into account your personal objectives, financial situations or needs. Before acting on any information provided, you should consider whether the information is suitable for you and your personal circumstances and if necessary, seek appropriate professional advice. All opinions, conclusions, forecasts or recommendations are reasonably held at the time of compilation but are subject to change without notice. Past performance is not an indication of future performance. Go Markets Pty Ltd, ABN 85 081 864 039, AFSL 254963 is a CFD issuer, and trading carries significant risks and is not suitable for everyone. You do not own or have any interest in the rights to the underlying assets. You should consider the appropriateness by reviewing our TMD, FSG, PDS and other CFD legal documents to ensure you understand the risks before you invest in CFDs. These documents are available here.
Any references to Australian or international shares, sectors, indices, ETFs, crypto-related stocks or other instruments are provided for market commentary and watchlist purposes only and do not constitute a recommendation, offer or solicitation to buy, sell or hold any financial product or adopt any investment strategy. International markets may involve additional risks, including currency fluctuations, regulatory differences, market structure differences, reduced liquidity and higher volatility. Company-specific, sector-specific and macroeconomic risks may also affect performance.
Commentary on geopolitical developments, economic data, central bank decisions, earnings, policy changes and other global or financial market events is based on information available at the time of publication and may change without notice. Such events can lead to sudden market moves, price gaps, reduced liquidity, wider spreads and increased volatility, particularly in leveraged products such as CFDs. Forward-looking statements, expectations and scenario analysis are inherently uncertain and should not be relied on as guarantees of future market behaviour or outcomes.