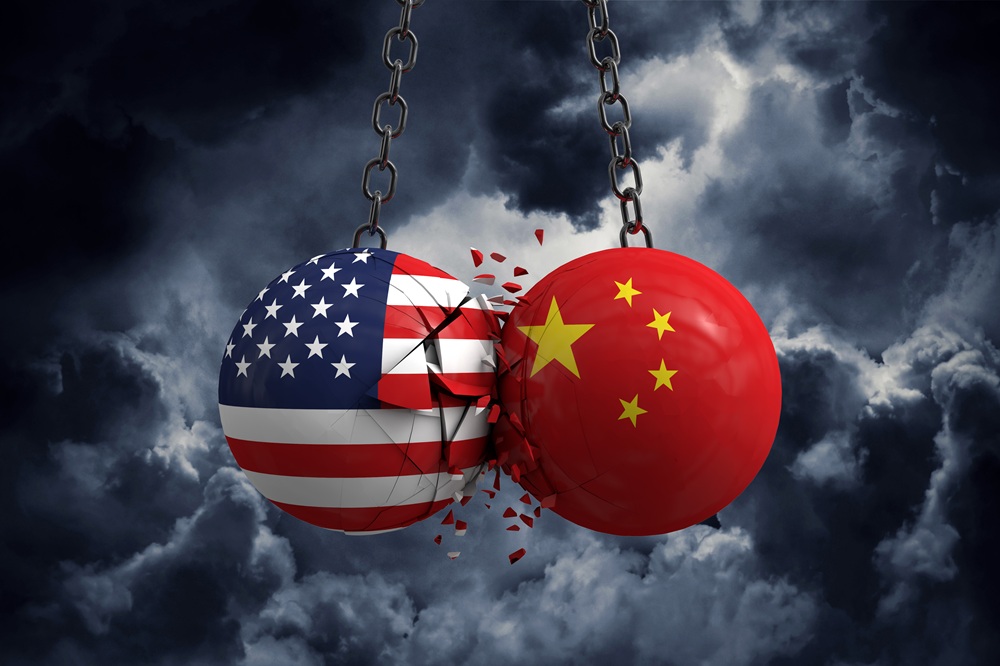
We have deliberately waited a few days before commenting on “Liberation Day” and the fallout that would come from President Trump’s new tariffs regime.It will go down as just another historical period of heightened volatility, uncertainty, risk, and a whole manner of market turmoil. This is why we wanted to put what is happening right now into some context. (If that is possible, considering how volatile the period is and how erratic and how quick the president's manner can change.)US markets have seen this kind of violent move only three times since the 1950s. The S&P’s over 10 per cent drop in the final two sessions of the week following President Trump's "Liberation Day" tariff announcement has it in rare company – and not in a good way - October 1987 (Black Monday), November 2008 (Global Financial Crisis), March 2020 (COVID-19).So, why such a reaction?The market reaction reflects not the ‘shock’ but the scale and brevity of the tariffs. A 10% across-the-board tariff was broadly expected. There were some calculations as much as 15 to 20% judging by the net $1 trillion in and out of the federal government revenue. (This is the impact of DOGE and other government spending cuts coupled with the tariffs now in place that will offset the promised 0% personal income tax for those earning up to US$150,000)But what markets didn’t see coming was the country-specific layer. Take China as an example; the additional 34% reciprocal tariff on Chinese goods pushed the total to 54%. With other measures factored in, the effective burden could approach 65%.Then there were the tariffs that were tied to trade deficits, hitting Japan, South Korea and most emerging markets between the eyes (i.e. Vietnam).The EU saw a 20% rate, which was within expectations, while the UK, Australia, New Zealand and others landed at 10%. Canada and Mexico were spared, as was Russia, North Korea and Belarus, interestingly enough.Energy was excluded, which is unsurprising considering Trump’s goal of getting energy down, down and staying down. Pharmaceuticals and semiconductors were also carved out, however, this is more down to the probability of more targeted action like that of steel and aluminium.Now, what is different about this market shock and risk off trading is that it would send funds flowing to the US dollar, ratcheting it higher. But not this time. The dollar weakened against the euro. Theories as to why range from Europe’s lighter tariff load to euro-based investors pulling money out of the US. The same could be said of the Swiss Franc.All this leads to an average effective tariff rate of around 22%. That number will likely climb once product-specific tariffs on areas like pharmaceuticals and lumber are formalised. Some of this may be negotiated down, but not soon, and the possibility of tit-for-tat retaliation like China has now entered into could actually see it going higher still as the President looks to outdo country responses.The broader uncertainty this introduces to the US outlook is now at its highest since early 2020 and has the markets pricing in 110 basis points of Fed rate cuts this year – a near 5 cut call shows just how unprecedented this is.In fact, in no time in living memory has a developed economy lifted trade barriers this aggressively or abruptly. What has been implemented is textbook economics 101 supply-side shock.Input costs go up, finished goods get pricier, and the ripple effects hit margins and employment. Expect to see this in the next six months.Expect core PCE inflation to finish the year at 3.5% —nearly a full percentage point higher than the consensus forecast from just a week ago.Real GDP growth is forecast to slow to 0.1% on a quarter-on-quarter basis. That path may be volatile as Q1 could look worse due to soft consumption and strong imports, with a mechanical bounce in Q2.What has been lost in the chaos of last Thursday and Friday’s trade was the March Non-farm payrolls jobs print came in at 228,000, which was above consensus, the caveat being it is less so after downward revisions to prior months.Hospitality hiring was strong, likely helped by a weather rebound that won’t repeat. Government payrolls are holding steady for now, but cuts are coming. Layoffs in defence and aerospace (DOGE) are already underway, and tariffs will act as a brake on new hiring. Expect softer reports ahead.Unemployment ticked up slightly to 4.15%, reflecting a modest rise in participation. That’s still within range, giving the Fed cover to hold off on immediate action. But if job losses build pressure on the Fed to act, it will increase quickly.The consensus now is for the first rate cut of this cycle to start in May, triggered by softer April payrolls and earlier signs of deterioration in jobless claims and business sentiment.Zooming out from just a US-centric point of view, the macro standpoint is just as bad if not worse. The scale of tariffs adds pressure on industrial production, trade volumes and cross-border investment.That’s feeding into commodity markets, where the outlook has turned more cautious.Brent is expected to fall into the low US$60s as trade frictions and oversupply build. LNG looks weaker too, with soft Asian demand and less urgency in Europe to restock. Iron ore is more exposed to China, and the reciprocal tariffs put a vulnerability into the price due to the broader global slowdown and higher prices to the US.Looking at China specifically, infrastructure remains a key policy lever that would offset the possible loss of demand in aluminium, copper, and steel. Monetary indicators are beginning to turn, suggesting the start of a new easing cycle. It also suggests that policy remains inward-facing, and a focus on domestic stability would mean a metals-heavy growth path. Thus suggesting Australia could be the ‘lucky country’ once more and could escape the full burden of the global upheaval.In short, the global reaction isn’t just about tariffs. It’s about what happens when policy shocks collide with already-fragile global demand, and central banks are forced to navigate inflation that’s driven by politics, not just price cycles.This is the question for traders and investors alike over the coming period.

Reportingdates and release times are based on company investor relations calendars whereconfirmed. Where dates or times are not marked confirmed, they are GO Marketsestimates. Consensus EPS, revenue and analyst-range data are sourced fromBloomberg and Earnings Whispers, as at 09 July 2026 (AEST). Company guidance,backlog and operating metrics are sourced from the latest company filings orresults presentations, unless stated otherwise. Any scenario analysis reflectsGO Markets analysis. Figures and schedules may change without notice.
The information provided is of general nature only and does not take into account your personal objectives, financial situations or needs. Before acting on any information provided, you should consider whether the information is suitable for you and your personal circumstances and if necessary, seek appropriate professional advice. All opinions, conclusions, forecasts or recommendations are reasonably held at the time of compilation but are subject to change without notice. Past performance is not an indication of future performance. Go Markets Pty Ltd, ABN 85 081 864 039, AFSL 254963 is a CFD issuer, and trading carries significant risks and is not suitable for everyone. You do not own or have any interest in the rights to the underlying assets. You should consider the appropriateness by reviewing our TMD, FSG, PDS and other CFD legal documents to ensure you understand the risks before you invest in CFDs. These documents are available here.
Any references to Australian or international shares, sectors, indices, ETFs, crypto-related stocks or other instruments are provided for market commentary and watchlist purposes only and do not constitute a recommendation, offer or solicitation to buy, sell or hold any financial product or adopt any investment strategy. International markets may involve additional risks, including currency fluctuations, regulatory differences, market structure differences, reduced liquidity and higher volatility. Company-specific, sector-specific and macroeconomic risks may also affect performance.
Commentary on geopolitical developments, economic data, central bank decisions, earnings, policy changes and other global or financial market events is based on information available at the time of publication and may change without notice. Such events can lead to sudden market moves, price gaps, reduced liquidity, wider spreads and increased volatility, particularly in leveraged products such as CFDs. Forward-looking statements, expectations and scenario analysis are inherently uncertain and should not be relied on as guarantees of future market behaviour or outcomes.