Academy
Academy

Trade the US earnings season

The Q1 2026 earnings season can move markets fast. Track upcoming earnings, plan your watchlist, and trade US share CFDs with tools built for active traders.

Most watched this season

Apple • Microsoft • Alphabet • Amazon • Nvidia • Meta • Tesla

Trade the US earnings season with GO Markets

The US earnings season brings a wave of earnings updates from major listed US companies. Results, guidance, and market expectations can shift quickly, driving volatility across individual stocks, sectors, and broader indices.

Competitive pricing

Stay cost-aware when trading around fast-moving reports.

Technical analysis tools

Use charts and indicators to plan entries, exits, and risk.

Built for active trading

Trade with fast execution and a reliable platform.

Risk management controls

Use built-in tools to define downside and protect positions during volatility.

More time to act

Extended hours are available on selected US share CFDs, giving you additional trading time beyond standard market sessions.*

*Availability varies by instrument. Trading conditions may differ outside regular market hours.

Most watched this season

US earnings calendar

Displayed times use Australian Eastern Standard Time (GMT+10). Change your timezone anytime in the Earnings Calendar settings.

News & analysis

Market insights
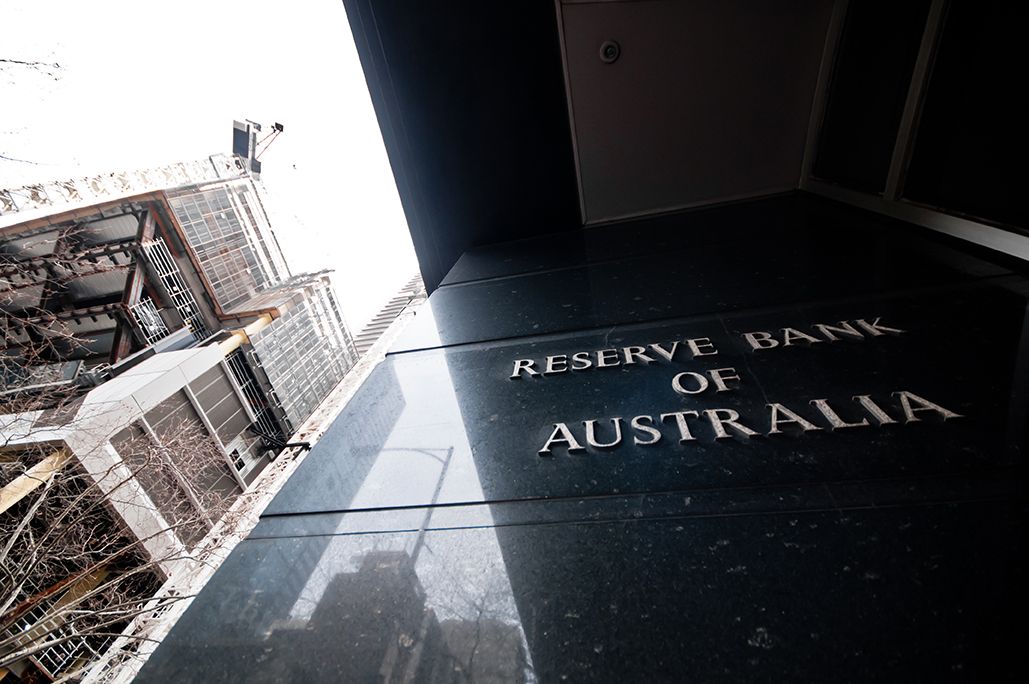
The gun has been fired: but is that it? The RBA, the AUD, and a thud

So for the first time in over four years the Reserve Bank of Australia (RBA) has cut the official cash rate by 25 basis points to 4.1%. They fired the gun they've loaded it for the possibility of more but are they blanks? Let's drive into what was said in the statement, what outlook was given and what this means for the Australian dollar and your trading going forward.

First – the action. The RBA made its first move in over a year 15 months to be exact, cutting the cash rate by 25 basis points to 4.1% at its February meeting. This marks the first rate reduction since November 2020, and marks what looks to be the other side of the “Table Top” mountain effect for the cash rate as we had discussed when the hike cycle began.

While the cut itself was widely expected - the RBA went full hawk in explaining what the outlook and rate cutting cycle will look like particularly on expectations of an extended easing cycle. To really highlight this point, have a look at the AUD when RBA Chair Michele Bullock was speaking on this point during her press conference. The short reversal is telling.

The crux of the whole position is - the RBA acknowledges progress on inflation but remains cautious about declaring victory. And that is a fair position to hold, core inflation is running at 3.2% and headline at 2.4%. Yet the bank is forecasting headline inflation to flare to 3.7% come December with core (trimmed mean) at 2.7% unchanged for TWO AND A HALF YEARS!

It reflects a delicate balancing act—while inflation is tracking lower, the labour market remains unexpectedly tight. The central bank wants (needs) more evidence before committing to further cuts, making it clear that markets are getting ahead of themselves hence the moves in the AUD. It begs the question: Why Cut Rates Now?

The Inflation-Labor Market Trade-Off Clearly the RBA’s decision to ease policy was largely driven by better-than-expected inflation data in Q4 2024. Disinflation has been happening faster than anticipated, which gave the central bank confidence to remove some policy restrictiveness, which it has always said it would as soon as it thought it could. But inflation is only one side of the equation.

The flip side is the labour market – which is hot and running hotter than expected. Unemployment remains at 4.2%, below the RBA’s estimated full employment level of 4.5%. While job vacancies have eased slightly, demand for workers remains strong, which could keep wage pressures elevated.

Caveat – the wage price index the day after the RBA meeting came in at 3.2% meaning in real wages terms wages growth is 0. But – it still presents a risk: easing too much too soon could reignite inflation, particularly in wage-sensitive sectors like services. Hence the hawkish stance.

As mentioned inflation is projected to settle at 2.7%—still above the 2.5% midpoint of its target range—while unemployment is expected to remain relatively low. This suggests that the RBA is not entirely convinced that inflation will continue declining without further policy restraint. The central bank is effectively saying: "We’ll cut where possible as we don’t want to leave policy restrictive any longer than necessary, but we’re not ready to call this the start of a full easing cycle." Is this just new aged jawboning?

Moderating the Market We feel we are now entering a new phase – upside jawboning a deliberate ploy to temper market expectations and more importantly – the consumer. The concern is that easing policy could trigger a rebound in spending, asset prices, and broader economic activity—creating inflationary pressures that could undo recent progress. This is why Governor Michele Bullock took a firm stance in her press conference, directly challenging the market’s expectation of multiple rate cuts and described the market’s pricing—which holds three additional cuts in 2025—as " far too confident." In short the Board’s message is clear: February’s cut does not automatically signal a sustained easing cycle.

The Board remains data-dependent and will only consider further rate reductions if inflation risks subside and the labour market shows definitive signs of cooling. What’s the biggest threat to the RBA? The Federal Election and Fiscal Policy Never underestimate a government and spending money – which makes fiscal policy risk number 1.

With a federal election due by May 17, government spending could play a significant role in shaping the economic outlook. If fiscal stimulus is ramped up, through cost-of-living relief measures or infrastructure spending, it will add upward pressure to inflation, thus reducing the urgency for further rate cuts. The RBA has explicitly stated that its forecasts do not assume any additional election-driven spending, meaning any surprises on this front could alter the rate outlook and the 3.7% headline figure could be worse.

Consumer and Housing Market Reactions Another key factor is how households respond to this rate cut. If consumer confidence rebounds strongly and household spending picks up, this may also signal a reassessment. Housing both prices and construction activity will be other critical indicators.

A surge in property market activity, driven by lower borrowing costs, could create renewed inflationary pressures, forcing the RBA to hold back on further cuts. And let’s be honest this has happened every easy cycle. Global Economic, Geopolitics The broader global economic landscape also plays a role.

If central banks in major economies, such as the US Federal Reserve, move more aggressively on rate cuts, this could influence the RBA’s decision-making. A more dovish global monetary environment could ease financial conditions in Australia, allowing the RBA to be more patient in its approach. Counter this with trade tariffs, trade wars and tit-for-tact reactions that increase inflation may lead to not only a long pause but also the risk of hikes.

Crystal ball time For now, the market has a cut fully priced in by the July meeting but the risk of a delay is growing. The RBA’s cautious approach suggests it wants more time to assess how inflation, employment, and economic activity evolve before making another move, suggesting September is a more likely month for the next cut, all things being equal. Ultimately, the path forward remains highly uncertain.

This means the central bank is unlikely to move quickly, and expectations of a rapid series of rate cuts may need to be revised. Hence as traders the AUD weakness may now have found a floor as cuts are not going to be as forthcoming. In short: while this cut marks the beginning of policy easing, it’s far from a signal that the RBA is on an aggressive cutting path.

The data will dictate the next steps, and for now, the Board remains firmly in watch-and-wait mode.

Evan Lucas
February 19, 2025
Market insights
The themes that keep on giving - Nationalism

We will keep on returning to the thematics of 2025 every single time they appear. Already two out of the five themes for this year have been the biggest movers of markets, and we expect this thing to continue throughout. Make no mistake, as in indices and FX traders, we're going to have to accept that volatility is going to grow from this point, something that we should embrace.

Clearly Washington and Beijing are going to be the main impactors geopolitically, While the US dollar, crude and gold will be the markets most likely to see movement that will attract us as traders. Which brings me to thematic 1 of 2025 nationalism. It is going to be the theme that keeps on giving this year, because clearly the president sees tariffs and the nationalisation of the US economy as the future of US growth and economic management.

We have waited to comment over what might transpire in markets around tariffs but is it now being official and with the US over the weekend announced that tariffs on imports from Canada, Mexico, and China will take effect on Tuesday, February 4, only for this to be held off for 30 days for Mexico and Canada due to ‘constructive changes from sovereign nations’. We need to highlight something every telling in what was originally proposed in the tariffs. “Imports from Mexico and Canada (excluding energy products) will face a 25% tariff, while Canadian energy products and all imports from China will be subject to a 10% tariff.” We can’t highlight enough how much crude is going to be a pawn in all trade war mongering going forward. The fact that the administration excluded Canadian energy products from the 25% tariff does show that the President is aware that adversely impacting one of the biggest consumption products in the US will be highly detrimental to POTUS personal standing.

It is something the administration is aware of and will do whatever it can to mitigate a core product increasing in price. However this also shows its hand – the retaliation from China is a 10% tariffs on US LNG coal and crude products. This hits the US where it hurts most, most will forget the US is the largest exporter of oil on the planet.

It just gets blurred when we look at OPEC as a whole and the fact that this cartel produces 21 to 23% of the world's global oil supplies. China doesn't have to play by the same rules as the US. It can get around its tariffs by going to nations such as Venezuela, something most in the West can't do.

Leaving the US with less trade revenue, a core product that appears more expensive to Chinese consumers that will inevitably look to other options and the dream of using tariffs to fund personal income tax cuts in tatters. But it's more than that too, in the words of the late great Milton Friedman: ‘tariffs are tax on the consumer not on the sovereign.” The upside risks to inflation in the coming months are growing by the day. The Fed has signed as much and now so has the market.

Which brings us to gold, the astronomical rise that we have seen in the price of gold over the last three to four weeks shows very clearly the inflation risk markets now see. The question we keep getting is how high can gold actually go? And add to this the chart shows that gold has actually broken through most resistance levels and is now trading in uncharted levels and making new highs daily.

It's not hard to see why, should tariffs on Canada and Mexico persist beyond a week or two, food and energy prices in headline inflation data could be affected relatively quickly. Indicators like daily retail gas prices and weekly food prices may provide early signals of the impact on headline CPI for February. Next Monday’s inflation report may actually be the first reading to show the effects of proposed tariffs and explain almost exclusively the capital that is flowing into gold.

For those out there looking to estimate how much tariffs would impact US CPI. Here is a previous estimate from the market around a 25% tariff on Canadian oil. A 25% tariff could push headline CPI up by approximately 0.2 percentage points alone with the broader tariffs pushing the upper-bound estimate by as much as 0.8 percentage points.

Approximately 10% of all US consumer spending involves imported goods, either directly or indirectly. With 25% of total imports facing a 25% tariff and approximately 17% subject to a 10% tariff, the potential inflationary impact is notable. Add to this the indirect effects we have already seen such as retaliatory tariffs or further trade tensions, add uncertainty.

These could and will push inflation expectations higher, posing a greater inflationary risk. Secondly, prolonged tariffs might also slow growth and employment - something indices traders will be very very aware of and considering the valuation of the S&P 500 and the like this is a concern. In short semantic 1 of nationalism is becoming an absolute core player in 2025 and opportunities and risks are presenting themselves readily.

As traders we need to be ready to take every opportunity that we can.

Evan Lucas
February 7, 2025
Market insights
When’s it our turn? A sustainable pivot

As we sit here and watch our overseas central bank counterparts move on interest rates. Our central bank gave us a new term, to explain why rate cuts are a long way off in their thinking. This term “sustainably” – that is “sustainably back to target”, “sustainable path”, and a hundred other zingers that basically point out that the central bank doesn’t think we are returning to the target band of its inflation mandate.

Yet despite this language and rhetoric, the movement in the market is – muted, bordering disobedient. The movement in the AUD has been strong as seen in the chart below. But that is basically down to the news out of China, (which we will come to later) and the US Fed finally pushing the trigger.

But domestically - the interbank and bond markets see rate cuts much sooner than the Board does, and if you look at the differentials between the RBA and the rest, there is a strong argument that the uptick in the AUD should be more than has occurred. What are we missing? So, what is it that the market sees that the RBA is missing?

Or more importantly – what does the RBA see that the market isn’t taking as seriously? First – we need to really drill into the August monthly inflation read, because there is some reasonable dispute between Board and Market. The headline monthly inflation rate fell to 2.7% and marks the first time in the post inflation era that Australia’s inflation has been back in the target 2% to 3% band.

Couple this with its decline from 3.5% in July and 4.0% in June. Thus, maybe the market has a point as it marks the lowest annual inflation rate since August 2021 and a sharp contrast to the 8.8% peak in December 2022. Which is why a lot are crowing about this chart from the ABS.

This may seem like a positive sign that inflation is under control and is ‘returning’ to a sustainable level, under the hood of the headlines, the data tells a different story. For example: The monthly index recorded a 0.24% decline between July and August, after a ‘no change’ from June to July. This decline is mainly down to a 0.58% increase in prices last August falling out of the 12-month calculation, so that is a one of and would be transitory and not sustainable.

We are also about to see another technicality happen this month when a similar 0.58% increase from September 2022 drops out. Even if we see a modest 0.2% rise between August and September, the headline inflation rate will likely fall further, potentially reaching 2.3% by September. This is a ‘seller beware’ issue for traders, bears will make a lot of noise about this but the RBA has made it clear here, it’s not for moving.

Next example: the August inflation drop is largely attributed to temporary relief measures. The whopping 14.6% decline in electricity prices in August was a direct result of the federal government’s $300 energy relief measure. The Queensland and WA state governments threw in $1000 and $400 respectively adding further downside in energy inflation.

Interestingly enough – since this has been pointed out the government has stated it might make the subsidy ‘semi-permanent’ again this is artificial and something the Governor has stated is transient. Finally August saw a 3.1% fall in petrol prices due to lower global oil prices – something that is likely to hold true for most of September but the increase tensions in the Middle East over the past week and China properly stimulating itself for the first time in the post COVID world coupled with the approaching Northern hemisphere winter that 3.1% reduction will be quickly returned. These highlight why the RBA never really pays much attention to headlines month-to-month quarter to quarter as it bounces around randomly.

And AUD traders in particular would be prudent to remember this. Stuck like a fly in a honey pot The catch with chasing the headline inflation figure is that although it may be back within the RBA’s target band the critical trimmed mean inflation rate, which excludes the most extreme price movers, is not. The trimmed mean rose by 3.4% over the year to August, down from 3.8% in July and 4.1% in June.

Now some will argue that is close to the band, but it’s still significantly above the RBA’s target range midpoint of 2.5% which is seen as the magical ‘sustainable’ point the RBA needs. For more context if we collate the first two months of the September quarter, the calculated annual underlying inflation rate sits at 3.6% even further away from the band and mid-point. The RBA’s most recent Statement of Monetary Policy forecast expects this to ease to 3.5% by the December quarter.

A full 1% above the midpoint illustrating just how stubborn inflation has been to budge. It’s even more of a headache when you look at where the stickiness sits Have a look at service-based inflation of education, health and financial services – these are all over 5% year on year. Then have a look at the housing.

Rent increases are still sitting at 6.8%, New dwellings 5.1%. These five things make up more than a third of the total CPI basket. There is nothing sustainable about these figures.

RBA versus the Market The RBA has been a pain to point out the issues of ‘purchasing power’, that long term issue of cost compounding on themselves and making essentials unattainable in the long run. This old adage is running through our heads: “short term pain for long term gain” thus from our views interest rates are staying on hold for the rest of 2024 as the RBA seems determined to make the inflation rate fall further before acting. Yet you wouldn't know it judging by the perception in the market - it is still pricing in a near enough to 75% chance of a rate cut at the December meeting.

How is that conclusion being reached? If we take what has been stated by the RBA as ‘baseline’ there is next to no information the RBA sees between November and December that would justify a cut especially if they do not cut in November. The only piece of additional information is the September quarter GDP figures (due first full week of December).

If that was to register a contraction and a recession is on the cards then maybe. That’s the only data that could trigger the RBA this year – but considering Government spending in this quarter is so large, the consumer will have had to really bottomed out and retail sales while poor are not that bad. With this in mind there is a real justification for the AUD to be higher than it currently is.

Each time we see another piece of data that is weak but not weak enough should be an upside mover for the currency. We are not normally ones to fight the market as the trend is your friend, and we are not considering the AUD has moved some 3.8% in September alone. It's more – we think the upside has more to go as the market realises it under-pricing a more hawkish RBA and it isn’t going to deliver Australian debtholders a Christmas present.

Evan Lucas
January 30, 2025
Market insights
US trading thematics Part 2: Data Confirming

Will June be the turning point? The market thinks it is – and its reaction to the CPI data not only signalled how it will trade in the coming months. It also showed that traders are primed to rotate to even more bullish positions.

Because from the market’s perspective September is now more than live its near enough to a lock for the Fed to cut rates. The Data: Core CPI (excluding food and fuel) saw an anaemic rise of just 0.065% month on month falling well short of the 0.2% consensus. Key component of the slowdown was in owners’ equivalent rent (OER) to 0.28% month on month, with primary rents decreasing to 0.26%.

This is the first real piece of data that is shown shelter is finally bucking its upward trend and moving to the lower side. But it wasn't the only good news in the data. Core services prices, excluding rents and OER, dropped by 0.07% month on month.

Its lowest level in over 12 months. Hotel prices declined by 2%, while airfares saw a significant 5% drop. Recreation services decreased by 0.1%, while personal services rose by 0.9% month on month, driven by a 4% spike in legal services.

Core goods prices dipped by 0.12% month on month, with used car prices down 1.5% and new car prices falling 0.2%. Apparel prices crept up 0.1%, but furniture prices fell 0.2%. Overall the core CPI P data should give the Federal Reserve that bit more confidence that it's returning to target and that its rate cut cycle can begin sooner than probably forecasted.

Moving to headline CPI for the first time in more than four years monthly inflation dropped down 0.1% month on month and eased to just 3% year on year a 12-month low which also happens to be the three year low. There's a pretty good reasonable explanation for this we saw a 3.8% slide in petrol pricing which held inflation back and offset the 0.2% increase in food and shelter. So it's not completely clear cut The Fed can cut rates in September.

But we digress because the market is suggesting it will treasury yields tumbled off the back of this you only have to look at the three year and the 10 year to understand that right cuts not only are they coming but are coming in waves. It really dropped into further FX trading with the US dollar once again under real pressure. The US dollar Is something that we are still wary of there is definite downside in certain pairs.

AUDUSD, NZDUSD have pretty clear reasons to see the appreciation bullishness that has been transpiring. But we're not as confident in EURUSD GBPUSD or even USDCAD. The other trading reactions of note With the CPI slowdown being more pronounced than anticipated, especially in shelter prices, which saw a 0.27% increase in owners' equivalent rent, akin to pre-pandemic levels.

It does also put first quarter CPI into the box of being a blip rather than the trend. We think one of the more interesting trading movements off the back of the June CPI was the rotation out of mega caps and into small caps. One of the reasons the S&P 500 and the NASDAQ hoping so strong since October last year Has been on the premise the Fed would cut rates in 2024-2025.

However realistically has been driven by the magnificent 7 particularly NVIDIA, Apple, Meta and Microsoft. So much so that it's actually papered over issues in industrials another non tech exposed sectors that have move no idea the level that the tech sector has. There's a big question that’s been building what happens post the first rate cut?

Its been driving the bullishness in equities but once it becomes actual what next? There's been somewhat of an answer in the trading post the CPI data which showed the S&P 500 and the NASDAQ declining well the Russell 2000 jumped. The suggestion here is the market is looking to move into even more bullish positions in equities but also to cash in on the anticipated first rate cut that has been developed since October 2023.

We think that is a trade we need to be mindful of because what may appear to be good news with regards to the right cut cycle beginning is probably already priced in. Multiples in the US markets are high multiples in US tech stocks are incredibly high. Which reminds us of the old market adage buy the rumour sell the fact.

And maybe just maybe the trading post the June CPI data gave us a massive insight into what could happen in either the September or November Fed meeting months. But returning to the data we can't go past the other economic data that may have been missed that again muddy the calls for a September rate cut. The Labor Department reported that weekly jobless claims fell to 222,000 a further 17,000 decrease from the previous week.

Its the lowest level since June 1. Continuing claims dropped to 1.85 million. This suggests that although last week's nonfarm payrolls was much lower than expected the overall employment market is still firm.

Employment has been cited by the likes of San Francisco president Mary Daly as a reason to cut sooner rather than later. However if employment was to remain solid it could actually say a reverse of the trading that we've seen from the CPI data. It's why we remain vigilant and once again why we think the USD is a tricky denominator, and only have confidence in pairs that have clear central bank differentials as we explained last week.

We now await the data of the next two months heading into September 18 to confirm all these views.

Evan Lucas
January 30, 2025
US Federal Reserve building with interest rate charts and economic data visualizations
Market insights
US trading thematics Part 3: More than the Trump trade

We've held off making comments about the events of what happened last weekend. Everyone has seen it, everyone knows the horrible scenario that it was but it is probably also meant that we have missed really key economic and fundamental trading reasons U.S. markets are now in a very broad bull market scenario. Inflation It was only 10 weeks ago an unexpected surge in inflation meant the dominant question in markets was if the Fed would cut rates this year at all.

Some five weeks later it increased to one rate but is a distant memory of the three forecasted in January this year. That is now all changed downside surprises to the second quarter inflation and the continued rise in the unemployment rate have not only met cuts are likely but for the first time in 10 weeks the market is now forecasting 100% likelihood of a September rate cut. Seen here: Source: CME FedWatch In fact, as this chart shows there's even expectations that it may not just be a 25 basis point cut it could possibly be more.

Remember the current federal funds rate is 525 to 550 basis points. As we've said before in this trading US series, once the US Federal Reserve starts its right cutting cycle, it is unlikely to stop until it reaches the neutral rate. Expectations are building from investment houses that there could be a possible rate cut in 2024 that being September and December.

This is at least the consensus some are even suggesting that November could be included as well seeing the January forecast coming to fruition. Will understand this more tonight when governor Waller presents and adds a function but it's likely that he will back chair Powell's comments on Monday that ‘rights will need to be lower by the year end’. We think this is what is being missed over this week in relation to the bull market in equities and the change in FX and bond markets.

You only have to look at the Russell 2000 to understand this change. The industry is now up over 12.5 per cent in the last month alone and 7.5 percent of that has come in the last seven days. Compare that to the NASDAQ for example which actually sat still over the same period.

This is due to the rotation trade based on right cut expectations not the Trump trade. Remember small cap firms are much more reliant on capital borrowings and thus much more susceptible to interest rate movements. The index has been much unloved over the last trading period as small caps have been left in the dust due to their risk and exposure to rate.

But with the prospect of right cuts plural, the attraction to risk the attraction to rotate out of fully valued trades makes sense. Here is the performance of the Russell 2000 S&P 500 and the NASDAQ over the past seven days Source: Refinitiv - White: Russel 2000 Yellow: NASDAQ Blue: S&P 500 What will be very interesting to see is something like NVIDIA becoming a funding source as it is begun to show evidence of being. We see in NVIDIA, Meta and Microsoft falling into this funding category over the coming weeks, as traders move into higher risk.

What we think might catch them out is earnings. Earnings This brings us to the second part of what is driving U.S. markets. Earning season so far and yes, it's a small sample size, has been astounding.

All have been at the upper end or above the Street View. You only have to look at JP Morgan, Morgan Stanley and most of the other major banks to see this. The bellwether Caterpillar, a forgotten darling, showed just how well it is doing in this ‘soft landing’ economy and surged over 5 percent on its results.

Again explains the rotation out of the magnificent 7 and into other sectors something we foreshadowed in part one. How it is also a warning sign, the probability that NVIDIA and the others beat expectations is high. The question we need to ask is will it be high enough?

As if the markets rotating out now could it become reporting day traders have to catch up to better than expected numbers and miss out on a possible next leg? It is something to ponder yourselves as you look to position for what is clearly going to be a strong US earning season. This brings us to Apple.

News this week that it achieved $8 billion in sales in India is something that can't be ignored. India is a market that Apple has severely underperformed in over the last several decades as its main competitor in Samsung took hold with cheaper more compelling phones. However, all that has changed since COVID, the interruptions it experienced taking supply chains out of China have seen it diversify into the world's second largest populous country.

There is only upside for Apple in this space. Secondly data this week showed how well it is now integrating AI into the Apple ecosystems. The links between its watch, phone, eyewear, laptop and iOS systems are strengthening by the day.

It is clear that over the next five years AI will make the ecosystem more intuitive and more attuned to everyday use. Thus making apple products that much more attractive and that much more needed by its mature and evolving marketplaces. This explains why Morgan Stanley this week suggested that in the coming two years Apple could become a $5 trillion company.

Apple is up over 20 per cent in the last month, and it could be the one that confirms the bull market in the US he's going to be sustained. These two points alone explain why the Trump trade is not the trade driving markets. Yes there is an influence and yes it is something we will talk about over the coming months leading into the US presidential election.

But we want to be clear that what really is happening with the Trump trade is behavioural bias and it is blocking out the clear rational evidence that is driving things and thus don't be distracted by what you see. Concentrate on the concrete evidence that's in front of us.

Evan Lucas
January 30, 2025
Market insights
US trading thematics: Part 1 “When Powell talks”

Over the coming 48 hours and then over the coming 2 weeks, Fed speak and US data is going to be some of the best trading opportunities in 2024. It’s been a pretty low-vol year despite several events that would under normal circumstances be triggers for much larger fluxes in FX and bonds. But to date: that has not been the case.

Let's look at the first part of what will be a clear mover of the USD, bonds and US equities. Fed speak First off let’s review day one of Federal Reserve Chair Jerome Powell two-day semi-annual testimony to the Senate and the resultant reactions. To paraphrase the core, take outs from the testimony - Powell continued to spew out the lines around “inflation has significantly declined from its four-decade peak reached two years ago”.

Yet despite this improvement, “central bank officials require more progress before considering an interest rate reduction, while closely monitoring the job market.” Furthermore he also dropped this broken record line “We do not expect it will be appropriate to reduce the target range for the federal funds rate until we have gained greater confidence that inflation is moving sustainably toward 2%,” Powell noted in his prepared testimony to Congress. During the hearing, he refrained from predicting a rate cut this year or specifying its timing, unlike previous comments. “The most recent inflation readings, however, have shown some modest further progress, and more good data would strengthen our confidence that inflation is moving sustainably toward 2%,” he added. All this is known knowns but what did create interest for us traders was this line that lit bond and FX markets up like a Christmas tree “Elevated inflation is not the only risk we face.

Reducing policy restraint too late or too little could unduly weaken economic activity and employment.” The reaction to this was clear, have a look at the impact this line had on the USD DXY – 1 minute chart AUD/USD at a 7-month high. It is chasing the 28 December high now of $0.687. From a trading perspective, the US CPI data on Thursday coupled with the employment data in Australia on July 18 and Australia’s CPI data on July 31 that could confirm if the pair do reach this point – on current forecasts – it’s probable.

The catch (seeming we will see over the coming day) is US inflation that has only just stabilised with last month’s data showing there wasn’t a price increase for the first time since November. It explains why it’s hard to argue that ‘we are not at a sustainable level’. It also explains why the dot plots for example are only one rate cut this year, down from the three forecasted in March.

But the dot plots do highlight that once cuts begin – there is likely to be a steady slide in the Federal funds rate. Thus, the start will signal the possibility of 6 rate cuts by the end of that said cycle. If we look at the Fed preferred measure of inflation, the Personal Consumption Expenditures (PCE) price index.

It showed no monthly rise in consumer prices for the first time since November as well, with an annual rate of 2.6%, slightly down from 2.7% in May. But as New York Fed President John Williams highlighted just last week “Inflation is currently around 2.5%, indicating significant progress, but we still have work to reach our 2% target consistently,” said. This brings us to Thursday’s CPI data.

Core CPI data is expected to land at 3.4% unchanged from the May read, headline CPI is expected to fall to 3.1% from 3.3% and would be near the June 2023 low of 3%. Watch this space to anything below these two estimates and the USD will be off to the races. The other interesting part of Fed speak has been the pivot to employment and the risks of a ballooning unemployment rate.

Take for example Powell’s Senate testimony that the labour market has normalised but still faces risks. He compared the current job market to its pre-pandemic state, that being “strong, but not overheated.” This was backed up by showing that although the unemployment rate has risen to its highest level in over two years, employers continue to hire robustly. Couple this with the fact the gap between job openings and unemployed job seekers has significantly narrowed over the past year – a typical sign of a strong jobs market.

Senate Chair Sherrod Brown of Ohio however countered this with “I’m concerned that if the Fed waits too long to lower rates, the Fed could undo the progress we’ve made in creating good-paying jobs,” Which brings us back once more to the statement the markets got most excited about – how long should it wait? Powell acknowledged the Fed’s challenge of balancing the risks of rekindling inflation by cutting rates too soon against the potential weakening of the labour market by waiting too long. The Fed’s dual mandate is to stabilise prices and maximize employment, noting a recent shift towards a balanced focus on both goals.

Is this a signal that September is live? Trading in the rates market now put the September meeting at an even chance of the first cut. Consumer behaviour suggest that the Fed might have lower borrowing costs.

US retailers have reported weaker-than-expected sales, and consumer demand has been tepid this summer compared to last year. So that is what the Fed is seeing – now we need to see the actuals backing this view – thus Part 2 of trading the US will be a deep dive into the CPI data and if there is enough evidence we are ‘sustainably returning to target’.

Evan Lucas
January 30, 2025